Lottery Number Frequency: Patterns, Biases, and Statistical Illusions
By Chronos Team • Feb 2, 2026 • 5 min read
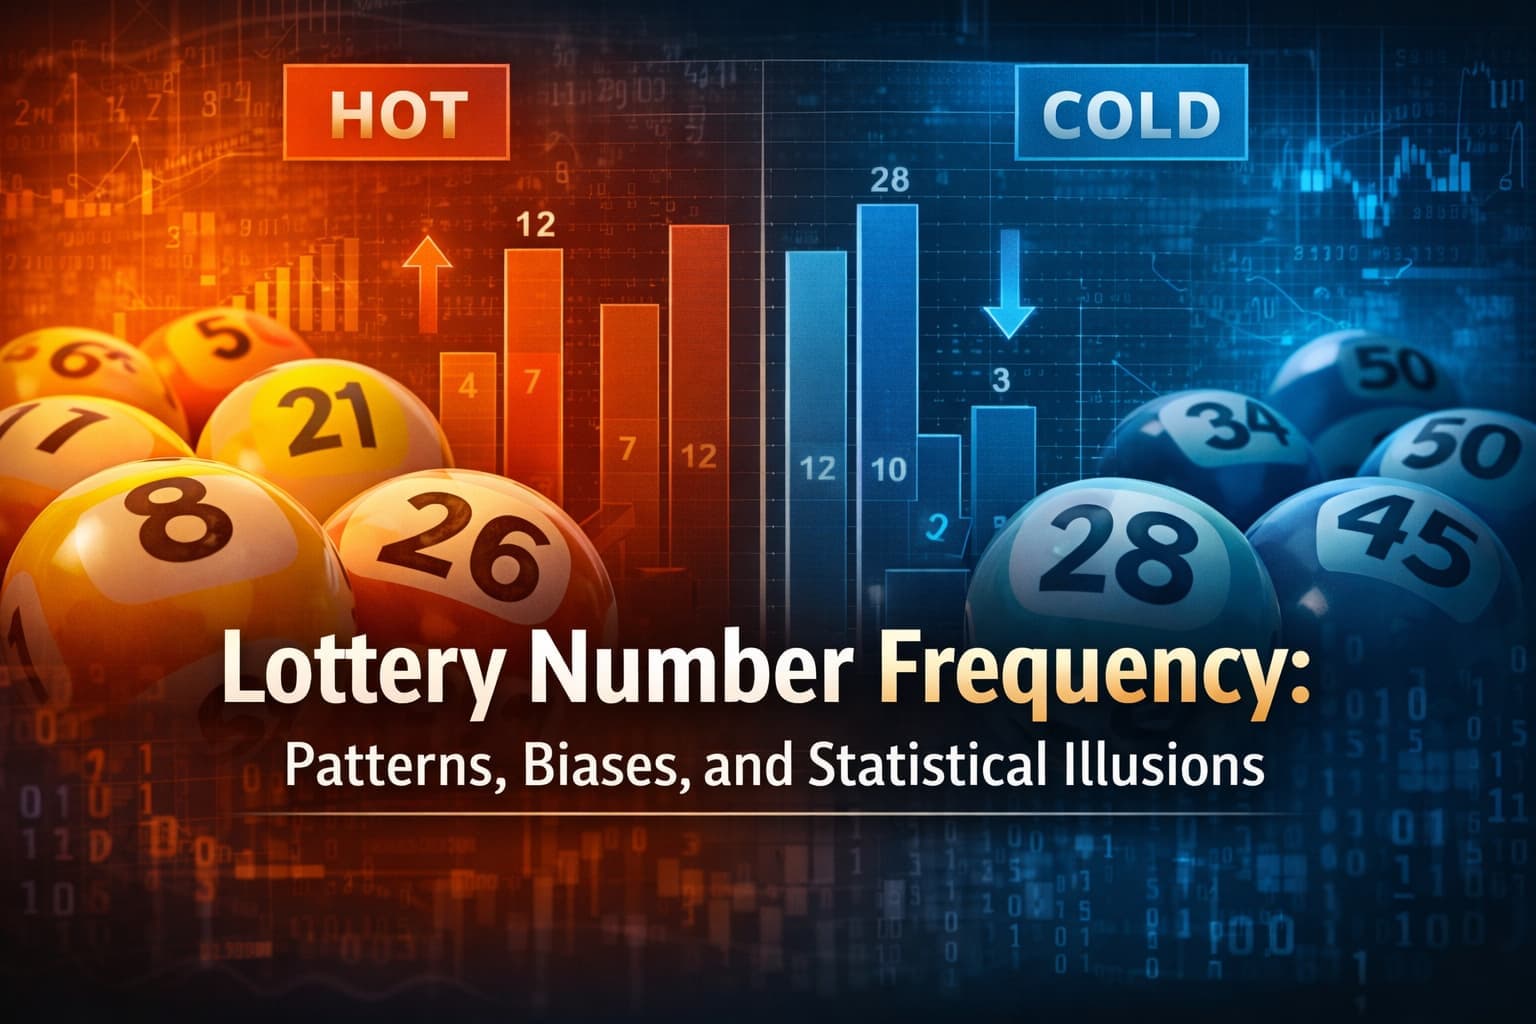
Some lottery numbers appear more often than others. At least, that’s what historical charts seem to suggest. “Hot” and “cold” numbers are among the most searched lottery concepts worldwide—but what do these patterns actually mean?
In this article, we explore number frequency analysis through a statistical lens, separating real mathematical effects from randomness-driven illusions.
What Number Frequency Really Measures
Number frequency analysis counts how often each number appears across historical lottery draws. On the surface, the idea is simple: if all numbers are equally likely, frequencies should converge over time.
In practice, several effects distort that intuition:
- Finite samples: True uniformity emerges only with extremely large datasets.
- Variance clustering: Random processes naturally produce streaks and gaps.
- Human pattern bias: The brain overweights visible deviations from expectation.
As a result, frequency charts often look meaningful—even when no causal mechanism exists.
Why “Hot” and “Cold” Numbers Exist
Lottery systems are designed to be random, but randomness does not mean evenly distributed at all times.
Frequency deviations can arise due to:
- Sampling noise: Shorter windows amplify apparent imbalance.
- Game mechanics: Ball wear, machine types, or rule changes can introduce subtle historical artifacts.
- Selection framing: Choosing observation windows post-hoc inflates perceived significance.
Crucially, historical imbalance does not imply future correction or continuation. Frequency describes the past—not the future.
How Chronos Uses Frequency Analysis
Chronos treats frequency analysis as a descriptive diagnostic, not a predictive engine.
The platform allows users to:
- Examine frequency distributions across different time windows
- Compare expected vs observed frequencies
- Identify structural breaks when rules or formats changed
This makes frequency analysis a powerful exploration tool—especially when combined with other statistical views.
How to Use Frequency Analysis in Chronos
To explore number frequencies:
- Go to Advanced Statistics (The Lab).
- Enable the "Frequency Distribution" strategy.
- Adjust the time window to compare short-term and long-term behaviour.
Smaller windows highlight volatility. Larger windows reveal convergence toward expectation.
What Frequency Analysis Can—and Cannot—Tell You
What it can do:
- Visualise how randomness behaves over time
- Reveal structural inconsistencies in historical data
- Expose common statistical misconceptions
What it cannot do:
- Identify “better” numbers
- Predict future draws
- Eliminate randomness
Understanding frequency is about interpretation, not optimisation.
Want to explore the numbers behind the numbers?
Explore Advanced Statistics
Explore Advanced Statistics
Discover data-driven predictions and strategies
Explore more from EuroLotto Prediction