Frequenza dei Numeri della Lotteria: Modelli, Bias e Illusioni Statistiche
Di Chronos Team • 2 Feb 2026 • 5 min di lettura
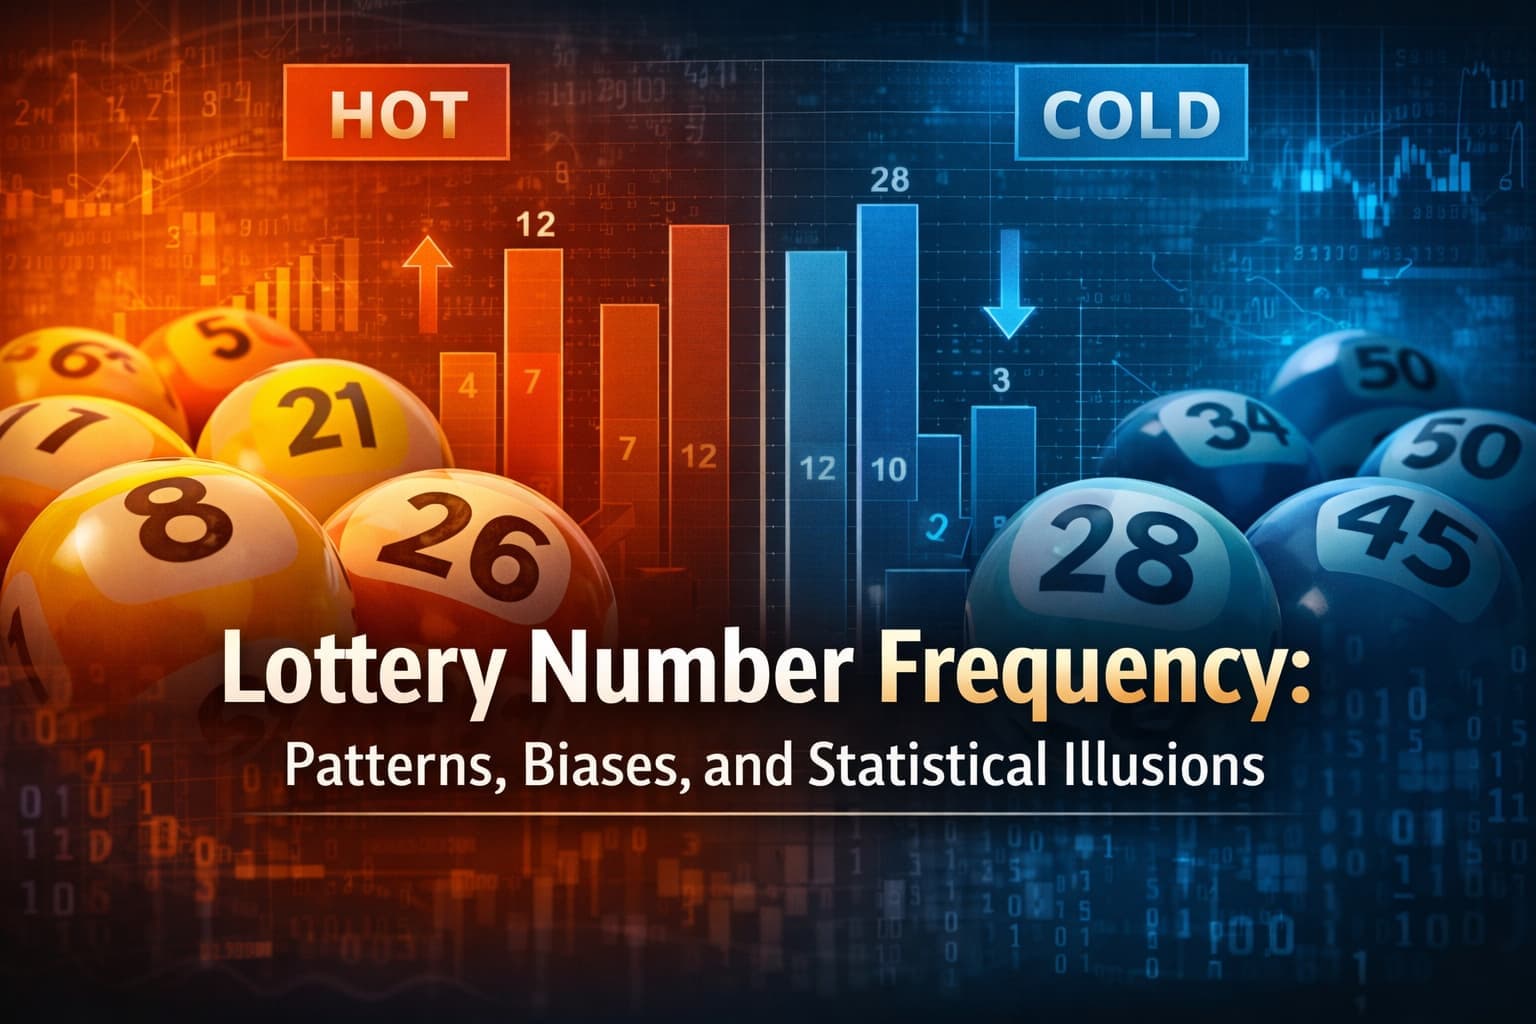
Alcuni numeri della lotteria appaiono più spesso di altri. Almeno, è ciò che sembrano suggerire i grafici storici. I numeri “caldi” e “freddi” sono tra i concetti di lotteria più ricercati a livello mondiale—ma cosa significano realmente questi modelli?
In questo articolo, esploriamo l'analisi della frequenza dei numeri attraverso una lente statistica, separando i veri effetti matematici dalle illusioni guidate dal caso.
Cosa Misura Davvero la Frequenza dei Numeri
L'analisi della frequenza dei numeri conta quante volte ciascun numero appare nei sorteggi storici della lotteria. In superficie, l'idea è semplice: se tutti i numeri hanno la stessa probabilità, le frequenze dovrebbero convergere nel tempo.
In pratica, diversi effetti distorcono quell'intuizione:
- Campioni finiti: La vera uniformità emerge solo con dataset estremamente grandi.
- Clustering della varianza: I processi casuali producono naturalmente serie e intervalli.
- Bias umano nei modelli: Il cervello sovrastima le deviazioni visibili dalle aspettative.
Di conseguenza, i grafici di frequenza spesso sembrano significativi—anche quando non esiste alcun meccanismo causale.
Perché Esistono Numeri “Caldi” e “Freddi”
I sistemi della lotteria sono progettati per essere casuali, ma casualità non significa distribuzione uniforme in ogni momento.
Le deviazioni di frequenza possono sorgere a causa di:
- Rumore di campionamento: Finestra temporali più brevi amplificano l'apparente squilibrio.
- Meccaniche di gioco: L'usura delle palline, i tipi di macchine o i cambiamenti nelle regole possono introdurre sottili artefatti storici.
- Inquadramento della selezione: Scegliere finestre di osservazione a posteriori gonfia la significatività percepita.
Fondamentalmente, uno squilibrio storico non implica una correzione o una continuazione futura. La frequenza descrive il passato—non il futuro.
Come Chronos Usa l'Analisi della Frequenza
Chronos tratta l'analisi della frequenza come un diagnostico descrittivo, non come un motore predittivo.
La piattaforma consente agli utenti di:
- Esaminare le distribuzioni di frequenza attraverso diverse finestre temporali
- Confrontare frequenze attese vs osservate
- Identificare rotture strutturali quando le regole o i formati sono cambiati
Questo rende l'analisi della frequenza uno strumento di esplorazione potente—soprattutto quando combinato con altre visioni statistiche.
Come Usare l'Analisi della Frequenza in Chronos
Per esplorare le frequenze dei numeri:
- Vai a Statistiche Avanzate (Il Laboratorio).
- Abilita la strategia "Distribuzione della Frequenza".
- Regola la finestra temporale per confrontare il comportamento a breve e lungo termine.
Finestre più piccole evidenziano la volatilità. Finestre più grandi rivelano la convergenza verso l'aspettativa.
Cosa Può—e Non Può—Dire l'Analisi della Frequenza
Cosa può fare:
- Visualizzare come si comporta il caso nel tempo
- Rivelare incoerenze strutturali nei dati storici
- Esporre comuni fraintendimenti statistici
Cosa non può fare:
- Identificare numeri “migliori”
- Predire i sorteggi futuri
- Eliminare la casualità
Comprendere la frequenza riguarda l'interpretazione, non l'ottimizzazione.
Vuoi esplorare i numeri dietro i numeri?
Esplora le Statistiche Avanzate
Esplora le Statistiche Avanzate
Discover data-driven predictions and strategies
Explore more from EuroLotto Prediction