Lotto Nummer Frekvens: Hvordan Mønstre Opstår i Tilfældige Systemer
Af Chronos Team • 30. jan 2026 • 6 min læsning
Hvis lotto trækninger er tilfældige, hvorfor optræder nogle numre så oftere end andre—i det mindste i en periode?
Mange spillere bemærker "varme" og "kolde" numre og undrer sig over, om frekvensmønstre afslører noget meningsfuldt. Matematik tilbyder en klar ramme til at udforske dette spørgsmål—uden at antage forudsigelighed.
Frekvens i Tilfældige Systemer: Hvad Matematikken Siger
I en virkelig tilfældig lotto har hvert nummer den samme sandsynlighed pr. træk.
Men tilfældighed betyder ikke ensartethed til enhver tid.
- Kortvarig variation er forventet: frekvenser svinger naturligt.
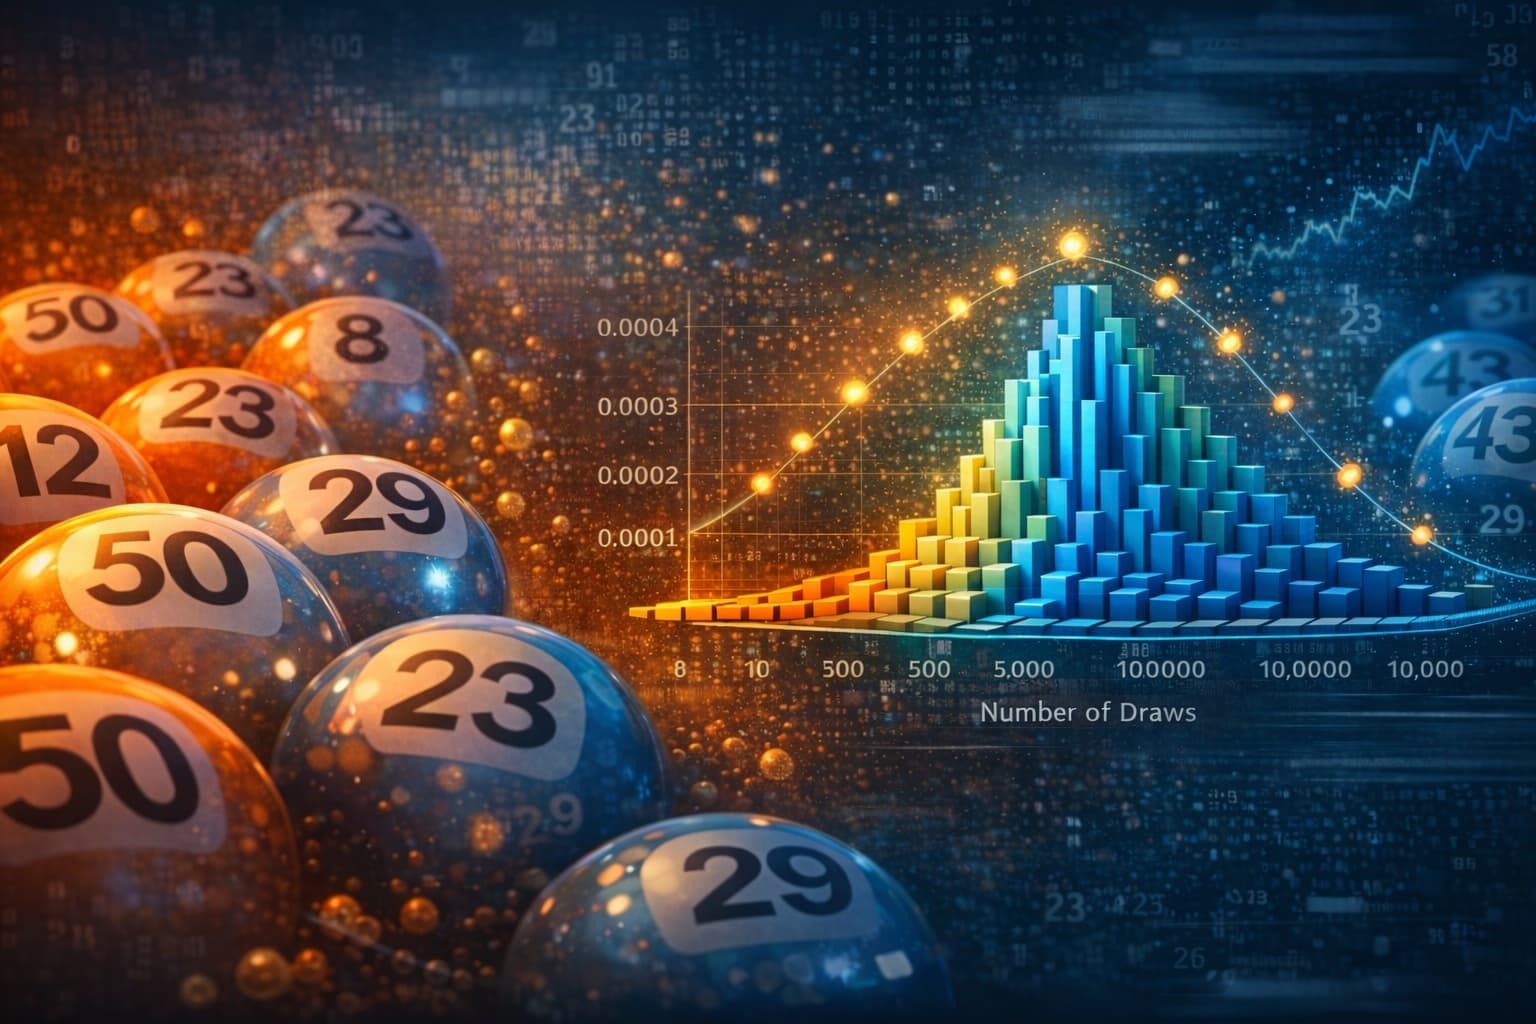
- Langsigtet konvergens betyder noget: over mange træk bevæger frekvenser sig mod balance.
- Tilsyneladende mønstre opstår naturligt: klynger og stræk er en del af tilfældig adfærd.
Frekvensanalyse tester ikke forudsigelse—det tester hvordan tilfældighed udfolder sig over tid.
Hvorfor "Varme" og "Kolde" Numre Opstår
Når man observerer historiske data, skiller nogle numre uundgåeligt sig ud:
- Et nummer kan fremstå "varmt" simpelthen på grund af normal varians.
- Et andet kan synes "koldt" på grund af midlertidig fravær.
- Menneskelig opfattelse har tendens til at overfortolke disse forskelle.
Dette betyder ikke, at frekvenser er meningsløse.
Det betyder, at de skal vurderes i kontekst og i stor skala.
Simulation vs. Historie: Hvorfor Skala Ændrer Fortolkning
Et centralt spørgsmål er, om observerede frekvenser opfører sig anderledes end hvad tilfældighed alene ville producere.
Ved at simulere et stort antal træk kan vi:
- sammenligne historiske frekvenser med simulerede baser,
- observere hvor hurtigt balance opstår,
- identificere om afvigelser vedvarer eller falmer.
Dette skifter diskussionen fra tro til måling.
Hvordan Frekvensanalyse Passer Ind i Chronos
Chronos betragter frekvens som et exploratorisk signal, ikke en forudsigelse.
- Gå til Avanceret Statistik (Laboratoriet).
- Aktiver Frekvensanalyse.
- Sammenlign historiske data med Monte Carlo simuleringer.
- Observer hvordan mønstre udvikler sig, når stikprøvestørrelsen øges.
Brugt korrekt hjælper frekvensanalyse med at besvare ét spørgsmål:
Vedvarer dette mønster ud over hvad tilfældighed typisk producerer?
Hvad Frekvens Kan—og Ikke Kan—Påvirke
- Frekvens ændrer ikke sandsynligheder pr. træk.
- Frekvens kan påvirke strategidesign, især når det kombineres med:
- simulering,
- strukturel analyse,
- og langsigtet testning.
Chronos muliggør disse sammenligninger gennemsigtigt, så brugerne kan udforske frekvenseffekter uden antagelser.
Nysgerrig på hvordan frekvens opfører sig, når tilfældighed skaleres op?
Udforsk Frekvensanalyse
Discover data-driven predictions and strategies
Explore more from EuroLotto Prediction